



This microsite is exclusive for Business Forum attendees.

Hydrogen Compass: India Navigator

Hydrogen Compass: India Navigator

About

Project Pipeline

India 101: Key Figures

Emerging Ecosystem

Hydrogen Compass:
India Navigator

Your window into India's clean hydrogen industry: projects, policy developments, and emerging ecosystems.

Based on the Global Hydrogen Compass 2026.

TAP TO
START

About

The Hydrogen Compass: India Navigator serves as a window into India’s clean hydrogen industry by presenting the industry’s projects, policy developments and emerging ecosystems. All information is based on the Hydrogen Council’s annual report, Global Hydrogen Compass 2026, where further information can be found across regions.


Project Pipeline

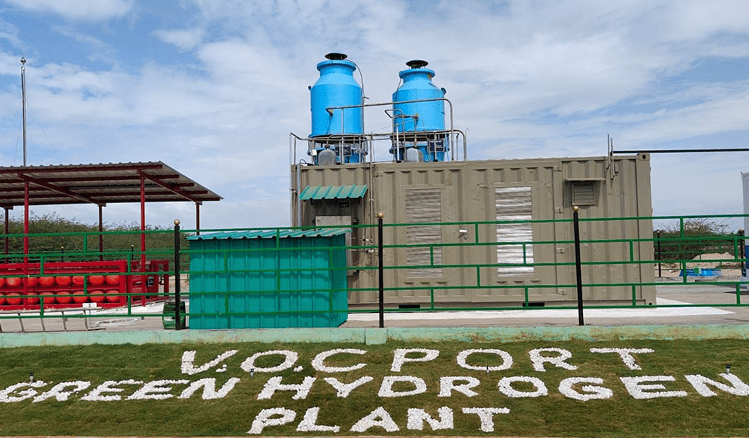
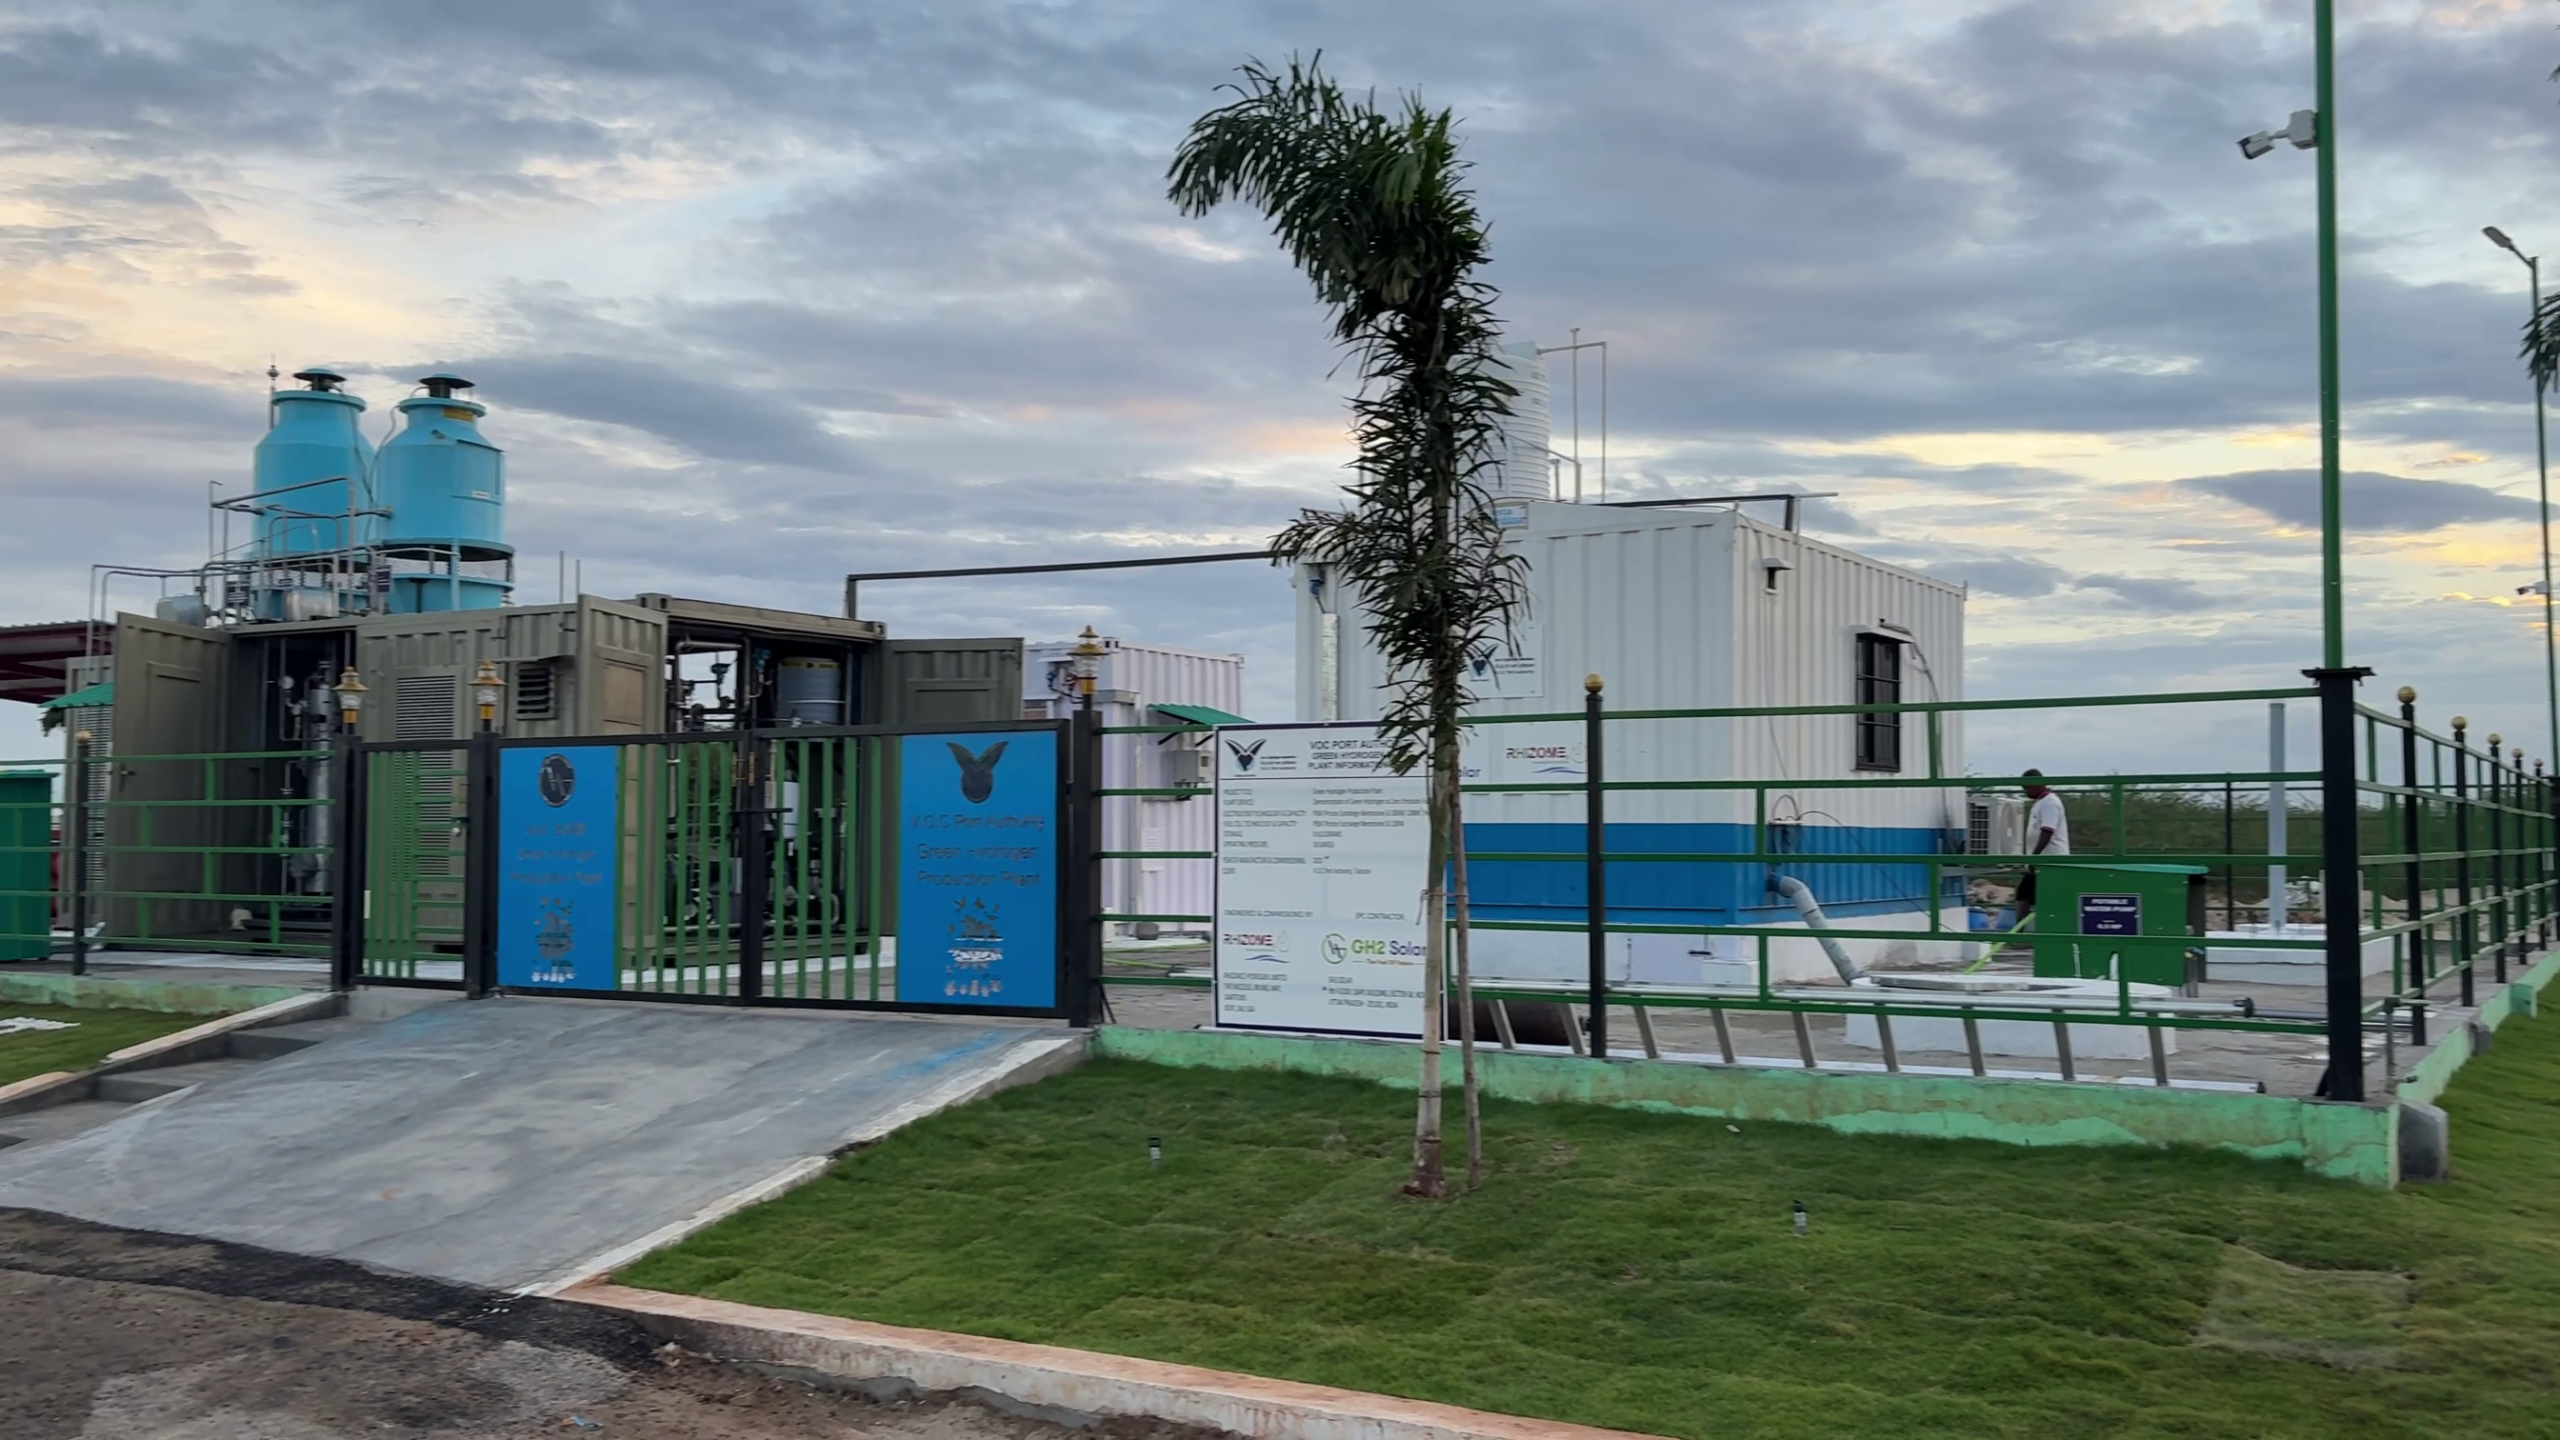
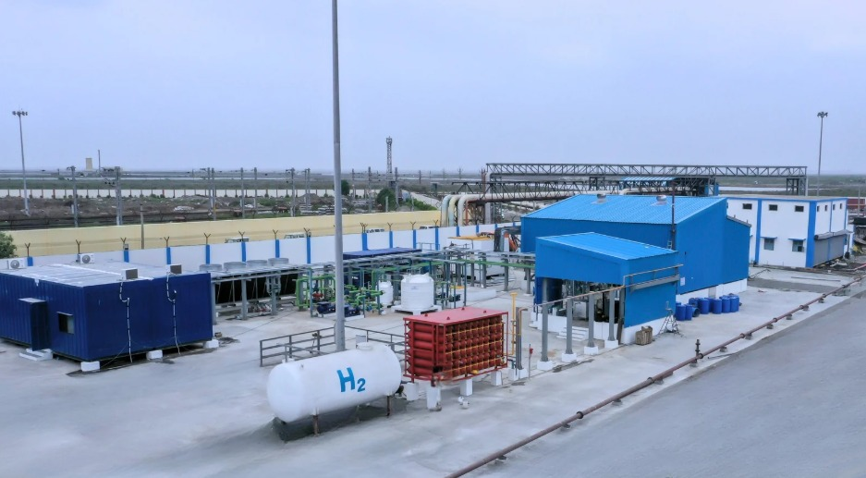
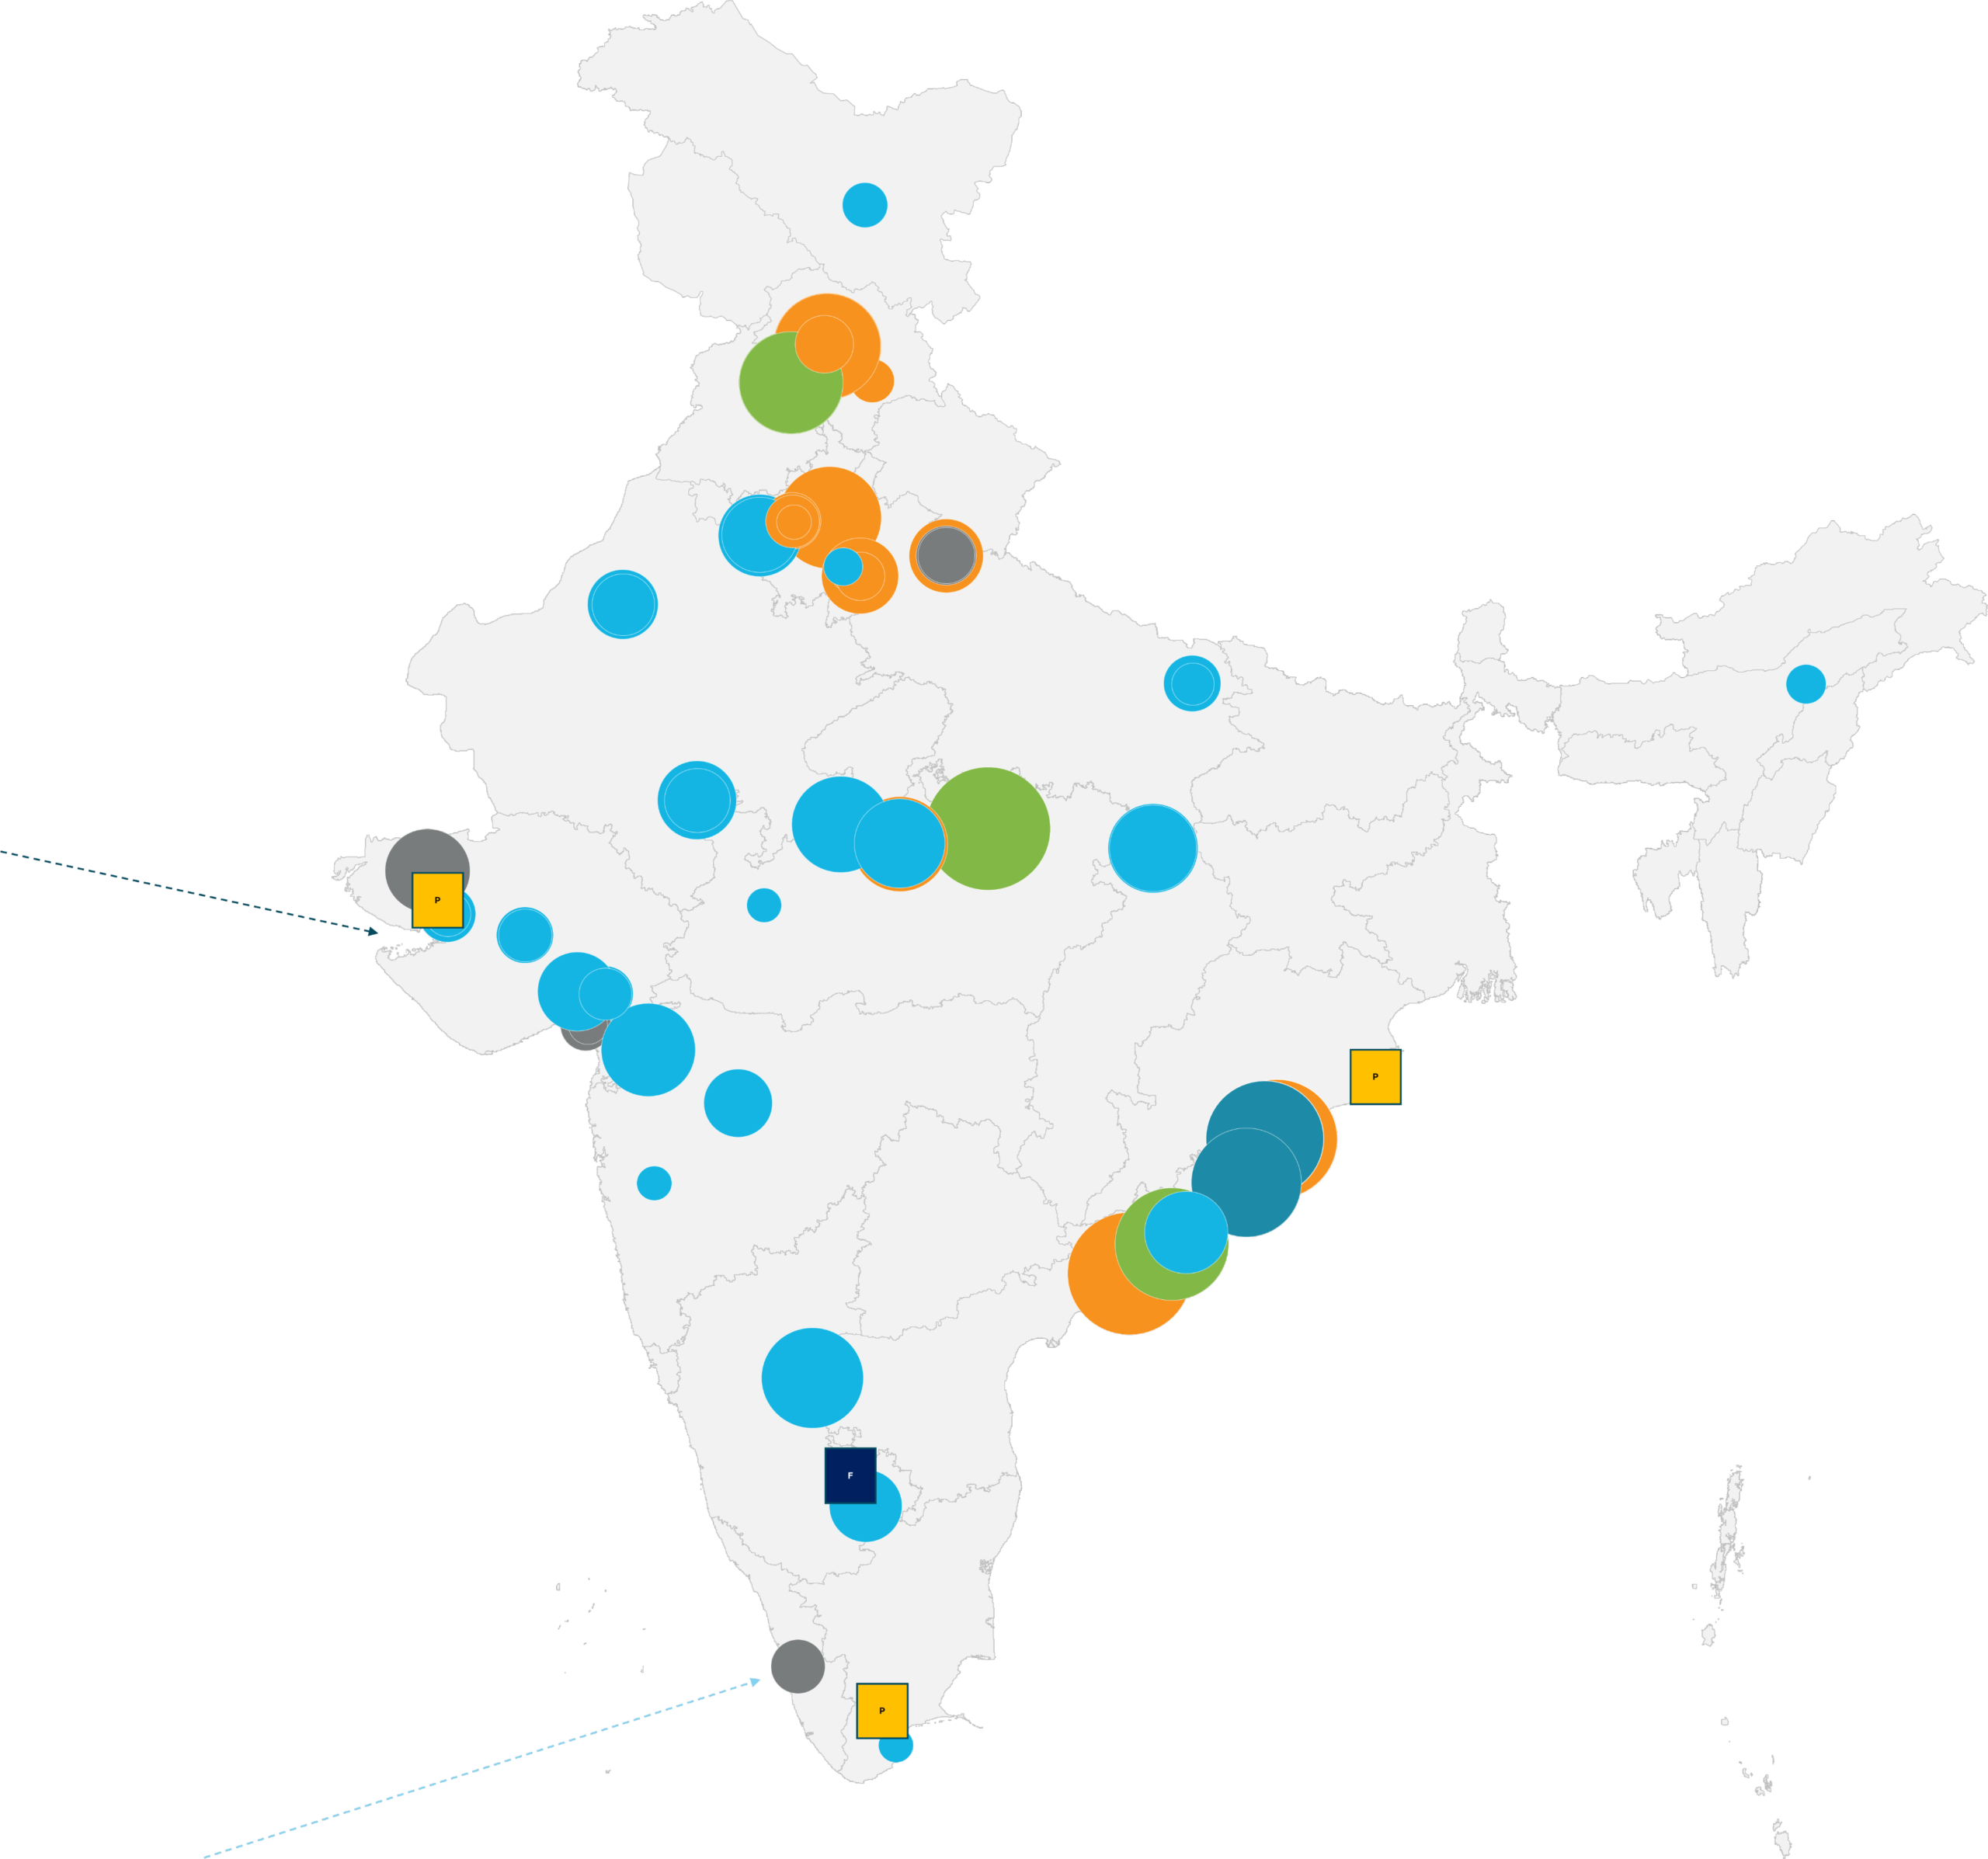
An interactive map of India's clean hydrogen projects and port infrastructure: explore locations, capacities, and development status across the country's emerging hydrogen ecosystem.

Click to Filter by Project Type

Pre-FID

Operational

FID/Under Construction

Ports

All

Location

Member Project

name

Description


Companies Involved: Involved

Project Status: Status

Commercial Operation Date (COD): COD

Hydrogen Pathway: Pathway

Total Production Capacity 2030 (MW): MW

Total Production Capacity 2030 (kton): kton


India 101: Key Figures

India stands out in clean hydrogen and ammonia because it pairs abundant, low-cost solar and wind resources with strong government support (the National Green Hydrogen Mission) to produce low-cost renewable hydrogen at scale.

It already has a large ammonia/fertilizer market to decarbonize domestically, plus coastal infrastructure well-suited for exporting to Asia and Europe. This combination of cost advantage, policy push, and energy security needs makes it a major one to watch.

National Targets

Current Status

5

Mtpa
National Green Hydrogen Mission 2030 Target
Aim to supply hydrogen at 1.5 -2 $/kg - SECI as the implementing agency
Click for More
India's flagship policy to position the country as a global hub for green hydrogen production and export.

2.4

BUSD
Targeted Investment
by 2030
Majority of funds for SIGHT scheme (manufacturing and production incentive)
Click for More
Competitive reverse auctions under the Mission that award per-kilogram incentives to electrolyser makers and renewable hydrogen producers.

6

BUSD
Committed Investment
by 2030
Based on Hydrogen Council data (Production to End-use)
Click for More

130

BUSD
Global Committed Investment by 2030

0.22

Mtpa
Committed Capacity
by 2030
Based on Hydrogen Council data
Click for More

6.9

Mtpa
Global Committed Investment by 2030

0.01

Mtpa
Operational Hydrogen Capacity
Based on Hydrogen Council data
Click for More

1.7

Mtpa
Global Operational Hydrogen Capacity

2.5-3

Mtpa (0.5-0.6 Mtpa Hydrogen)
Total Ammonia
Import Demand
Imports for fertilizer currently supplied by grey ammonia (total consumption is 10X)
Click for More

~80%

of India’s ammonia consumption relies on imports

0.72

Mtpa (0.1 Mtpa Hydrogen)
Firm Ammonia 2030 Demand
Awarded SIGHT auction volumes
Click for More

6

Mtpa
Firm Hydrogen Demand Globally by 2030

5

Mtpa
National Green Hydrogen Mission 2030 Target
Aim to supply hydrogen at 1,5 -2 $/kg - SECI as the implementing agency
Click for More
India's flagship policy to position the country as a global hub for green hydrogen production and export.

2.4

BUSD
Targeted Investment
by 2030
Majority of funds for SIGHT scheme (manufacturing and production incentive)
Click for More
Competitive reverse auctions under the Mission that award per-kilogram incentives to electrolyser makers and renewable hydrogen producers.

6

BUSD
Committed Investment
by 2030
Based on Hydrogen Council data (Production to End-use)
Click for More

130

BUSD
Global Committed Investment by 2030

0.22

Mtpa
Committed Capacity
by 2030
Based on Hydrogen Council data
Click for More

6.9

Mtpa
Global Committed Investment by 2030

0.01

Mtpa
Operational Hydrogen Capacity
Based on Hydrogen Council data
Click for More

1.7

Mtpa
Global Operational Hydrogen Capacity

2.5-3

Mtpa (0.5-0.6 Mtpa Hydrogen)
Total Ammonia
Import Demand
Imports for fertilizer currently supplied by grey ammonia (total consumption is 10X)
Click for More

~80%

of India’s ammonia consumption relies on imports

0.72

Mtpa (0.1 Mtpa Hydrogen)
Firm Ammonia 2030 Demand
Awarded SIGHT auction volumes
Click for More

6

Mtpa
Firm Hydrogen Demand Globally by 2030


Emerging Ecosystem

India translates low-cost renewables into bankable domestic ammonia, reducing import dependence and enabling new exports.

Cost-Competitive Supply

Resources and cost structures that enable hydrogen production.

Click for More

Infrastructure

Hard infrastructure (pipelines, ports, etc.) and soft infrastructure (CI certificates, trading frameworks) that physically and commercially connect supply and demand.

Click for More

Bankable Demand

Captive industrial demand or regulatory mandate that creates financeable, bankable offtake.

Click for More

Market Activation

Policy, financing and coordination that tie the value chain together and enable scale.

Click for More

900-1100


100-200


150-250


75-100


TBD


550-600


EU Production Cost

Power
Sourcing

Electrolysis Plant
Capex

Electrolyzer Utilization

Additional Levers

India
Auction

EU Production Cost

Power
Sourcing

Electrolysis Plant
CAPEX

Electrolyzer Utilization

Additional Levers

India
Auction

​Power Sourcing: Reducing power costs from ~$55 to ~$30-40/MWh enabled by less stringent sourcing standards.¹

1. As produced, Indian green ammonia would not meet RFNBO standards.


Electrolysis Plant CAPEX: ​Reducing CAPEX to ~$700/kW, from a baseline of ~$1,700/kW, likely using Chinese systems.


Electrolyzer Utilization: Increasing utilization to ~90% from ~65%, enabled by annual matching and energy storage resources.


Additional Levers: ​​Additional levers, including subsidy (worth ~$20/t NH3), refinancing options, sales into high WtP export markets.


India Auction: 470-570 $/ton. Estimated production cost range needed to potentially compete with post-ETS/CBAM conventional ammonia in EU.
550-600 $/ton

India SIGHT auction result — achieved renewable NH3 production cost from integrated developers.

What makes it work:

  1. Power at Lowest Global Cost:
Solar/wind hybrid at $0.02-0.03/kWh with >65% capacity factors.

  2. Chinese Electrolyzer Systems: CAPEX reduced to ~$700/kW from ~$1,700/kW EU baseline.

  3. High Utilization via Annual Matching: ~90% utilization (vs ~65% baseline) enabled by energy storage resources.

  4. SIGHT Incentives:
$0.60-1.10/kg production incentives (Tranche II, 3 years).

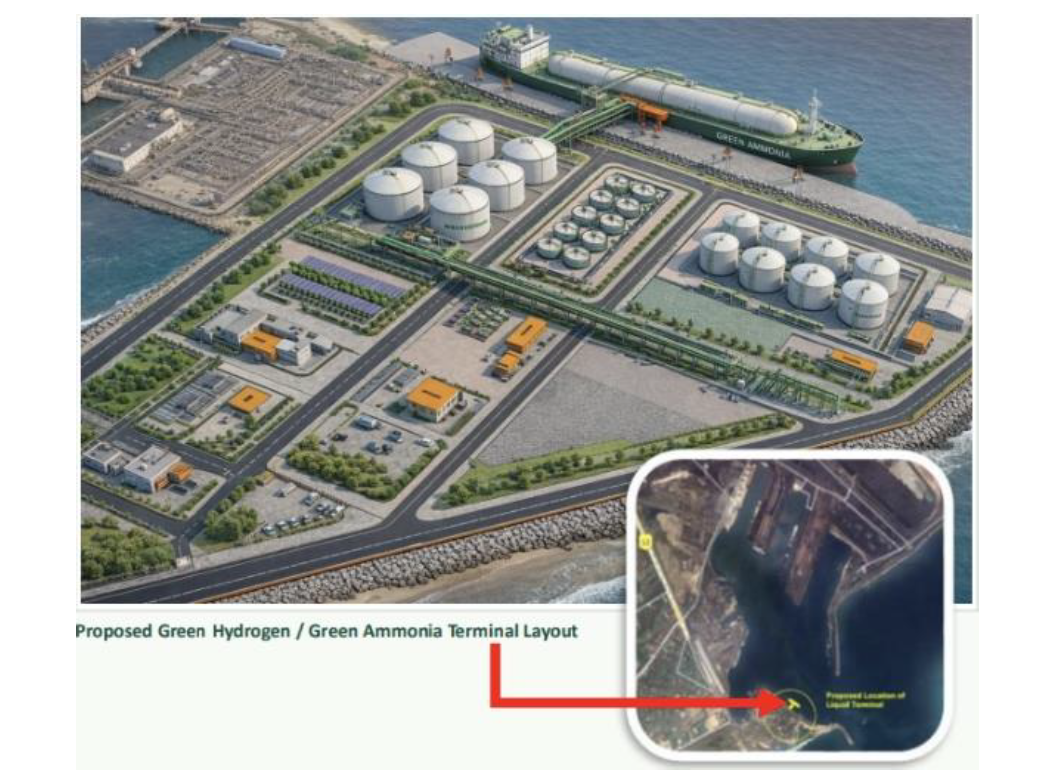
Integrated renewables, ammonia production, and port infrastructure enable export-ready supply chains.

Projects (By Maturity)

Operational

Commissioned

Under Construction

FID

FEED

2030: Cumulative capacity, ktpa

0

88

Infrastructure

NGHM-Designated H2 Hub Port

Electrolyzer Factory

LNG Import Routes

Strait of Hormuz

Other LNG

Fertilizer import substitution creates a bankable domestic market for green ammonia.

​Total direct liquid ammonia imports into India
724
kpta

Tranche 1 of SIGHT auctions awarded for liquid ammonia import displacement 
(~25-30% of direct liquid ammonia imports)

0.7

1.8

2.5-3

Ecosystem-specific context & supporting policy landscape.

SIGHT auctions secure domestic green NH3 offtake

SIGHT awards production volumes; NGHM waives transmission fees; certification needed for EU export

$2.5
billiion

Projected savings from initial awarded Tranche of SIGHT Ammonia auctions

Emerging Ecosystem

India translates low-cost renewables into bankable domestic ammonia, reducing import dependence and enabling new exports.

Cost-Competitive Supply
Resources and cost structures that enable hydrogen production.

Low-cost renewable resources enable renewable ammonia to compete with imported supply.

Comparison between European and India renewable NH3 production cost, $/ton NH3

EU Production Cost

Power
Sourcing

Electrolysis Plant
Capex

Electrolyzer Utilization

Additional Levers

India
Auction

EU Production Cost

Power
Sourcing

Electrolysis Plant
Capex

Electrolyzer Utilization

Additional Levers

India
Auction

900-1100


100-200


150-250


75-100


TBD


550-600


For more information, visit the cost leadership section below.

EU Production Cost

Power
Sourcing

Electrolysis Plant
CAPEX

Electrolyzer Utilization

Additional Levers

India
Auction

Fertilizer import substitution creates a bankable domestic market for green ammonia.

​Total direct liquid ammonia imports into India

724
kpta

Tranche 1 of SIGHT auctions awarded for liquid ammonia import displacement 
(~25-30% of direct liquid ammonia imports)

0.7

1.8

2.5-3

Integrated renewables, ammonia production, and port infrastructure enable export-ready supply chains.

Projects (By Maturity)

Operational

Commissioned

Under Construction

FID

FEED

2030: Cumulative capacity, ktpa

0

88

Infrastructure

NGHM-Designated H2 Hub Port

Electrolyzer Factory

LNG Import Routes

Strait of Hormuz

Other LNG

Ecosystem-specific context & supporting policy landscape.

SIGHT auctions secure domestic green NH3 offtake

SIGHT awards production volumes; NGHM waives transmission fees; certification needed for EU export

$2.5
billiion

Projected savings from initial awarded Tranche of SIGHT Ammonia auctions


Cost Leadership

India leverages a combination of flexible sourcing of  low-cost renewable power, with low cost electrolyzers to bring ammonia production cost to at or below $600/t.

900-1100


100-200


150-250


75-100


TBD


550-600


EU Production Cost

Power
Sourcing

Electrolysis Plant
Capex

Electrolyzer Utilization

Additional Levers

India
Auction

EU Production Cost

Power
Sourcing

Electrolysis Plant
CAPEX

Electrolyzer Utilization

Additional Levers

India
Auction

​Power Sourcing: Reducing power costs from ~$55 to ~$30-40/MWh enabled by less stringent sourcing standards.¹

1. and there should be a footnote stating “As produced, Indian green ammonia would not meet RFNBO standards”


Electrolysis Plant CAPEX: ​Reducing CAPEX to ~$700/kW, from a baseline of ~$1,700/kW, likely using Chinese systems.


Electrolyzer Utilization: Increasing utilization to ~90% from ~65%, enabled by annual matching and energy storage resources.


Additional Levers: ​​Additional levers, including subsidy (worth ~$20/t NH3), refinancing options, sales into high WtP export markets.


India Auction: 470-570 $/ton. Estimated production cost range needed to potentially compete with post-ETS/CBAM conventional ammonia in EU.

550-600 $/ton

India SIGHT auction result — achieved renewable NH3 production cost from integrated developers.

What makes it work:

  1. Power at Lowest Global Cost:
Solar/wind hybrid at $0.02-0.03/kWh with >65% capacity factors.

  2. Chinese Electrolyzer Systems: CAPEX reduced to ~$700/kW from ~$1,700/kW EU baseline.

  3. High Utilization via Annual Matching: ~90% utilization (vs ~65% baseline) enabled by energy storage resources.

  4. SIGHT Incentives:
$0.60-1.10/kg production incentives (Tranche II, 3 years).